Global Superstore Sales Overview
Project at Glance
In this project, i will try to demonstrate an end-to-end data analyst project from business request to dashboard overview. The data used in this project comes from a Global Superstore company, and the user is a Sales Manager who want to know the company sales condition around the globe.
Business Request & Demand Overview
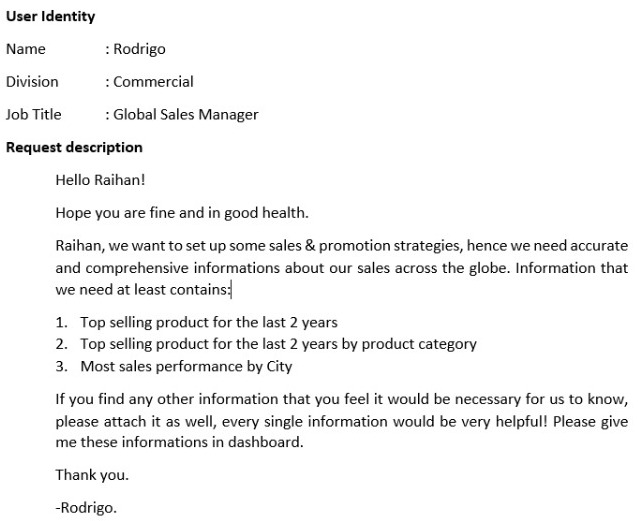
In every data analytics/business inteliigence project, there must be a business request and demand overview from the user who will take advantage of the result/output. The user request for this project can be seen as below:
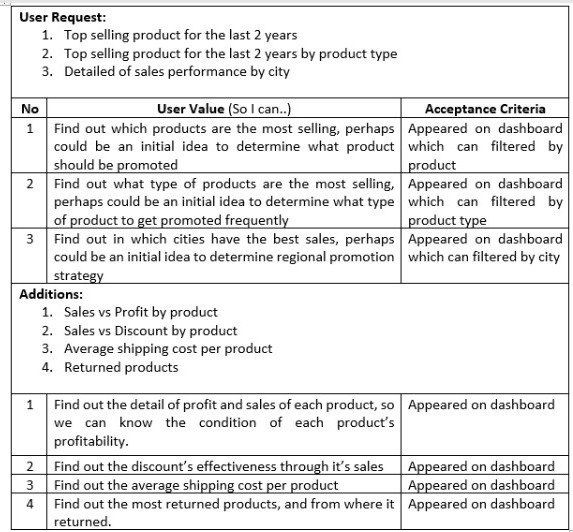
Hence, below is the business demand overview for the requested and additional information:
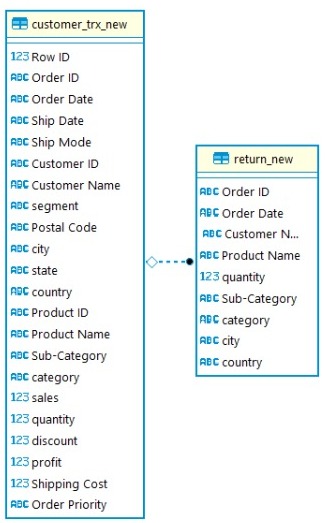
Database ER Diagram
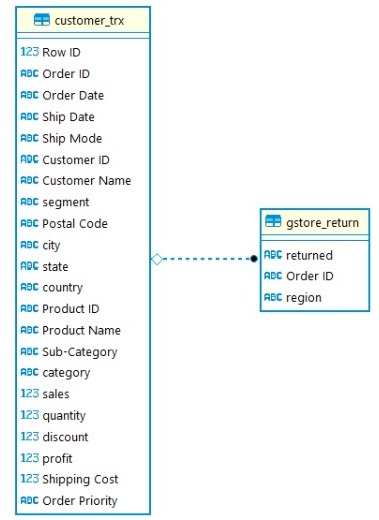
The database’s entity-relationship from which the data is taken can be seen below:
Data Cleansing & Transformation
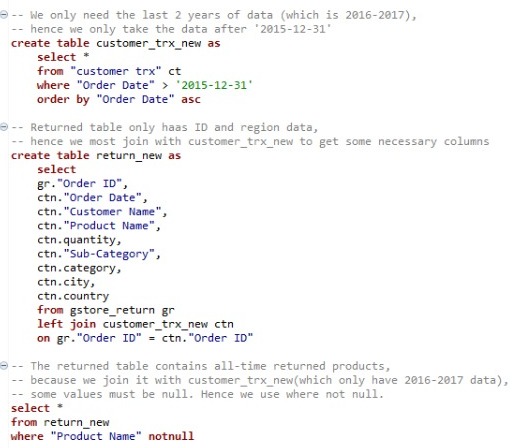
Because the database is still so simple, we don’t need too complicated queries to get the required data. Below is the SQL query for the data:
Data Involved
The data involved for the input to Power BI can be seen as below:
Dashboard Overview
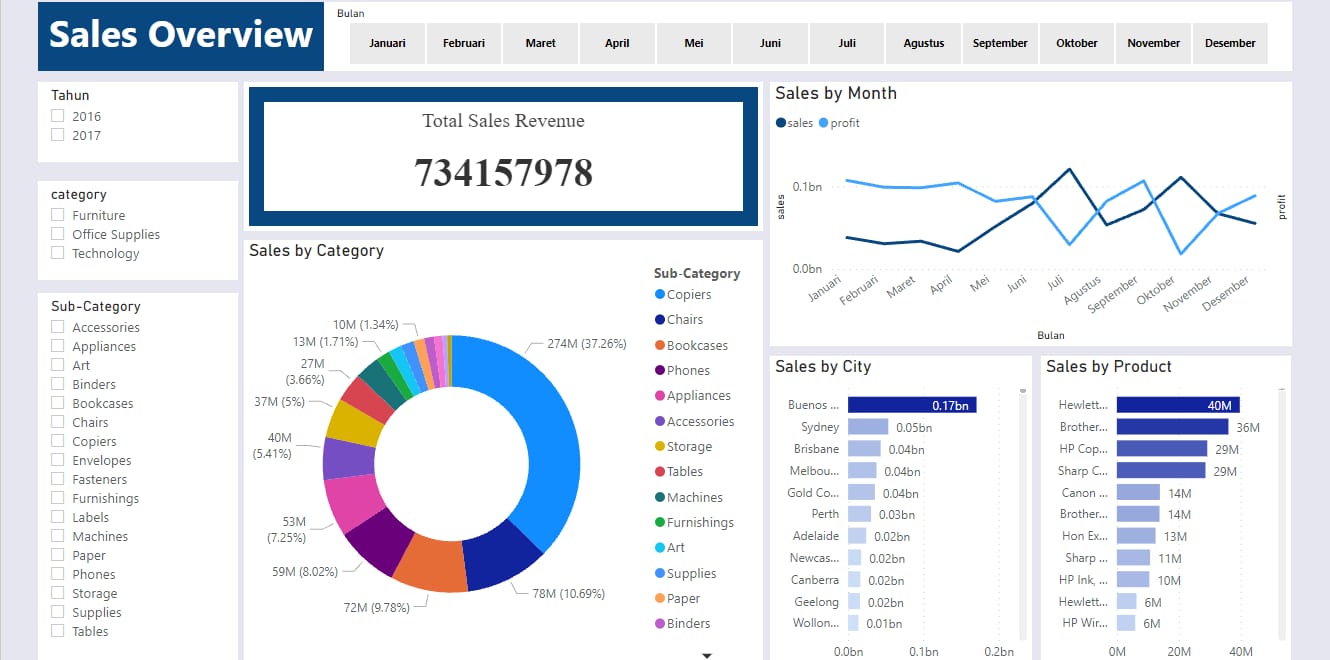
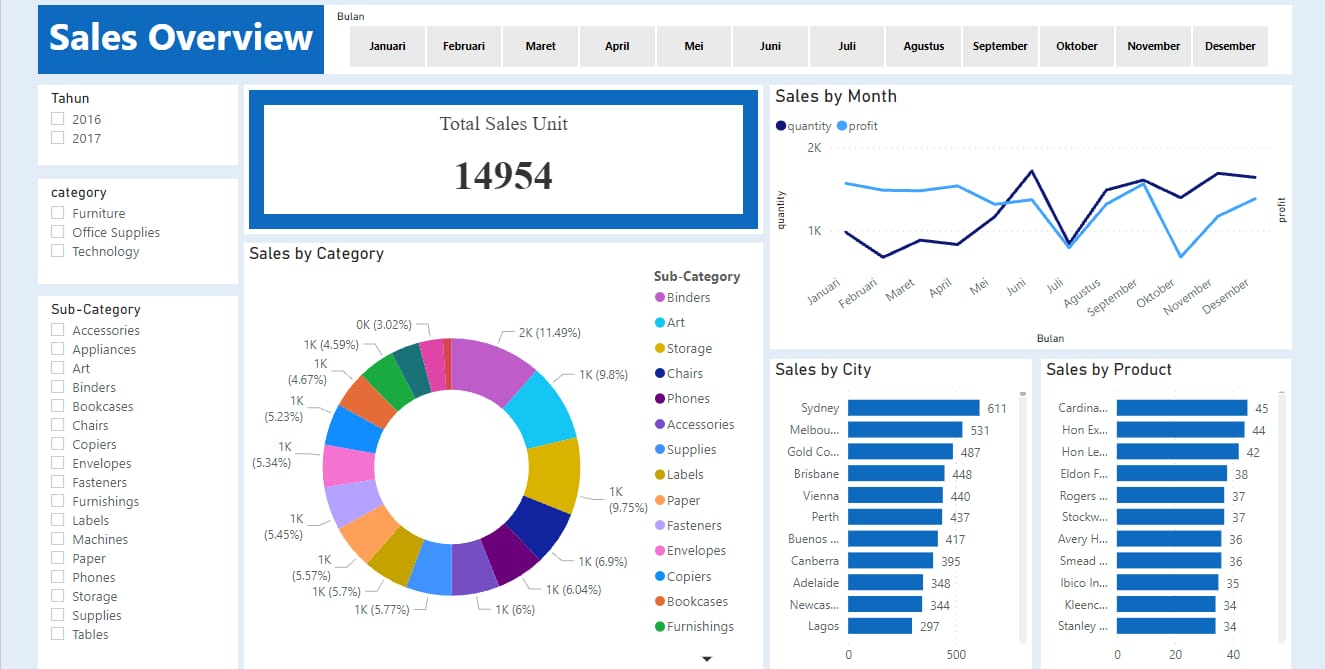
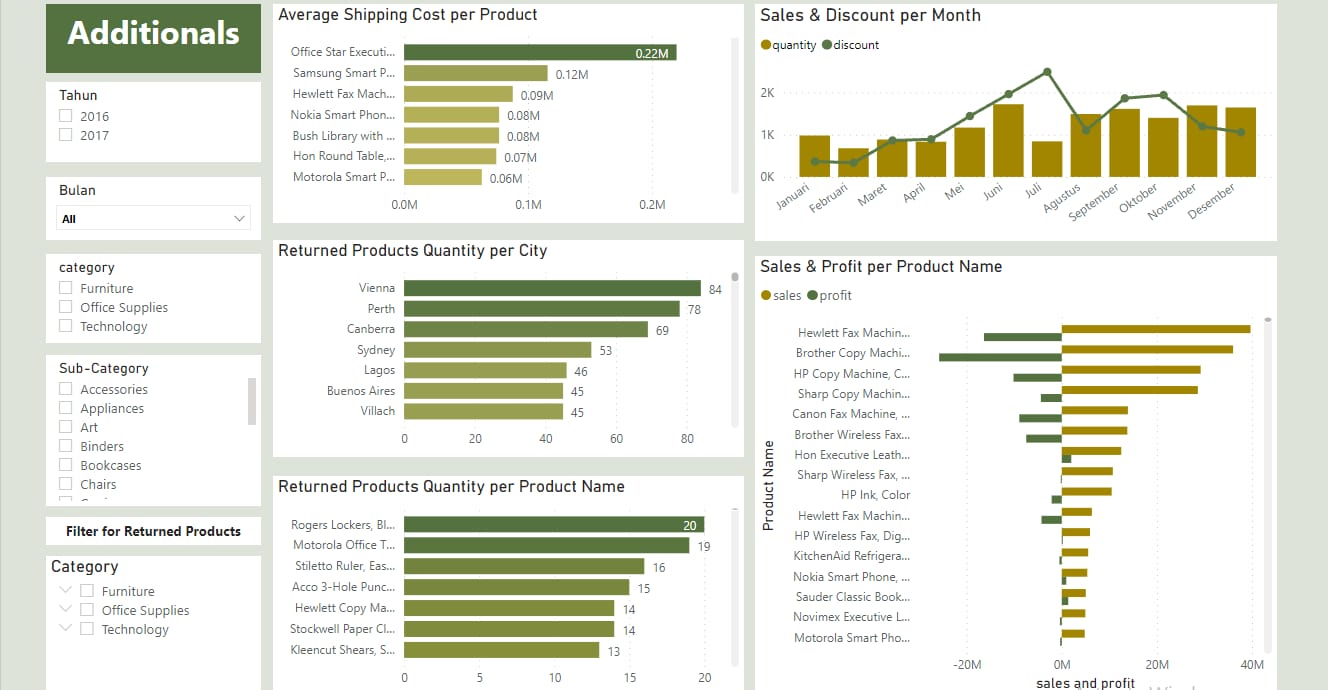
The dasboard result:
*Sales by Revenue
*Sales by Quantity
*Additional Info
Full Interactive Dashboard : Dashboard