Mexico Toy Store Company
Project at Glance
In this project, i will try to demonstrate an end-to-end data analyst/business intelligence project from a Mexican Toy Store company. The user of this project is a Commercial Director who want to get a comprehensive dashboard for presenting sales performance of the budget year.
Business Request & Demand Overview
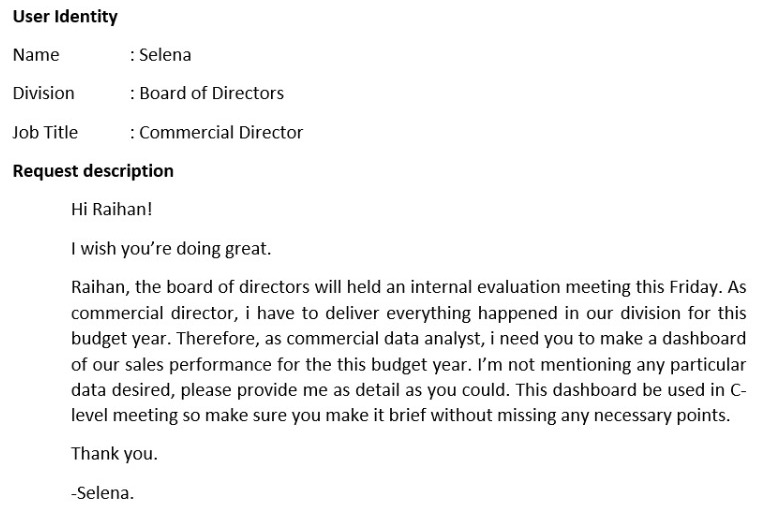
In every data analytics/business inteliigence project, there must be a business request and demand overview from the user who will take advantage of the result/output. The user request for this project can be seen as below:
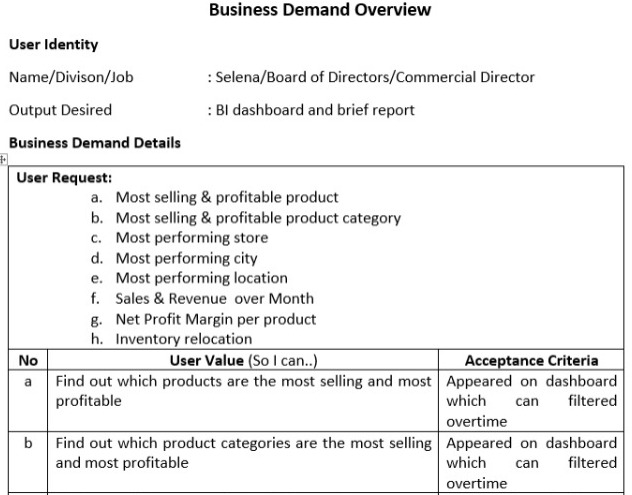
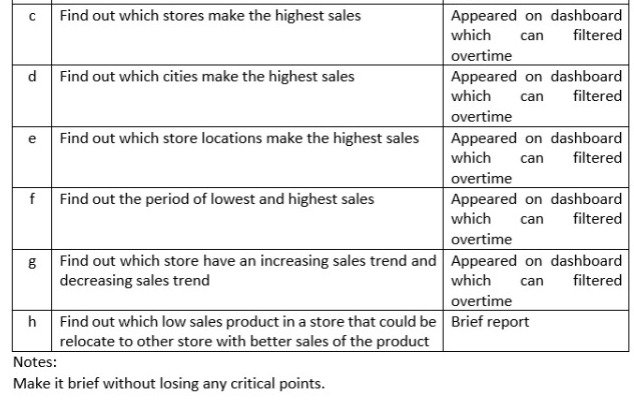
Hence, below is the business demand overview for the requested and additional information:
Database ER Diagram
The database’s entity-relationship (ER) from which the data is taken can be seen below:

Data Cleansing & Transformation
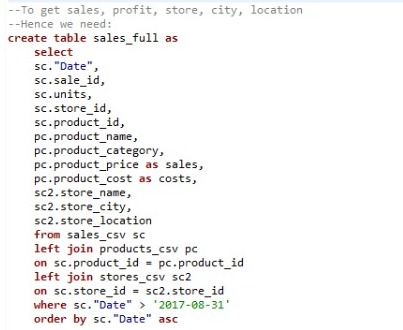
We must clean and transform the data required from database. Below is the SQL query for the data:
Data Involved
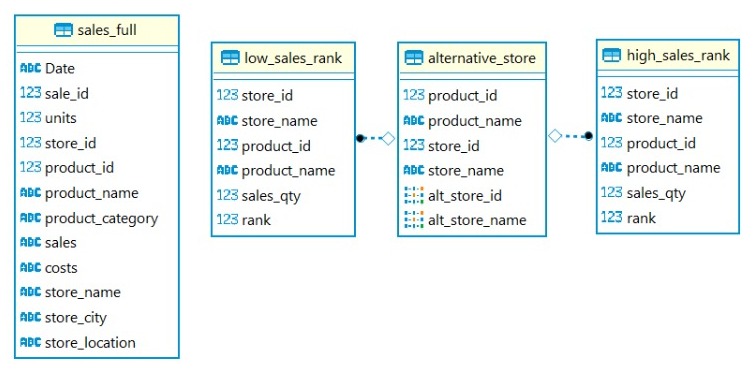
The data involved for the input to Power BI can be seen as below:
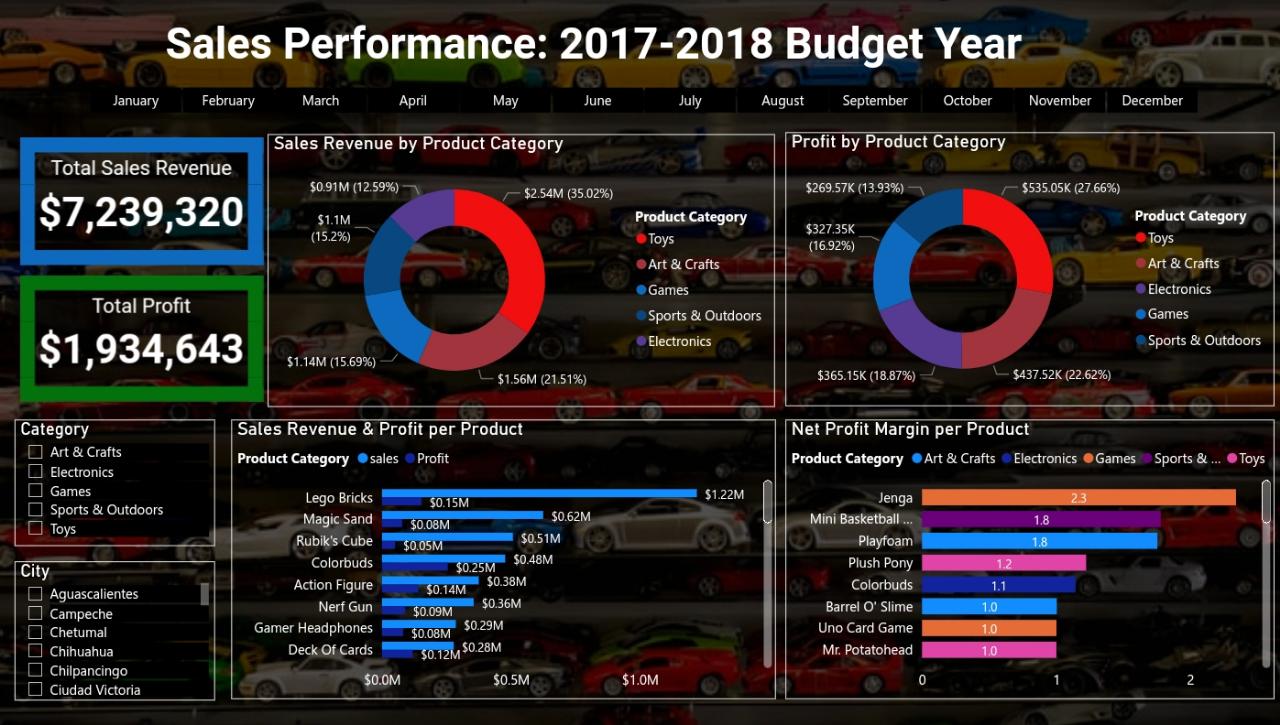
Dashboard Overview
The dasboard result:
*Sales Performance 1
*Sales Performance 2
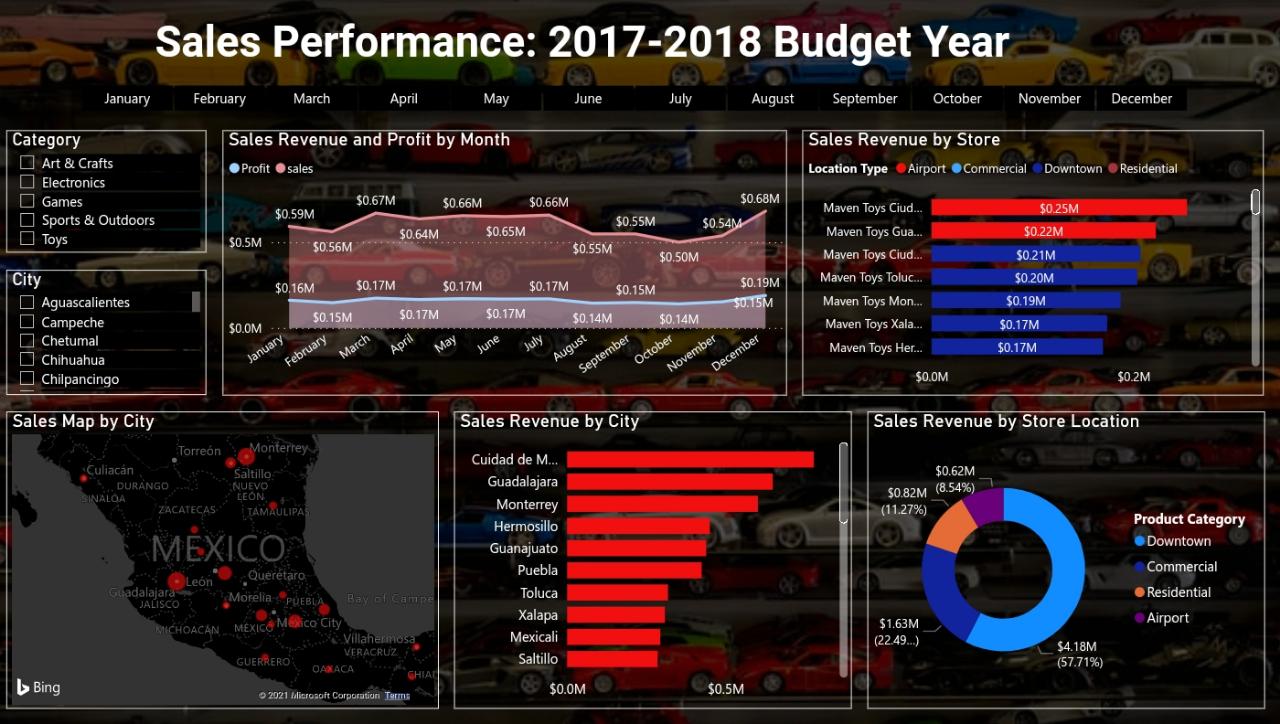
Full Interactive Dashboard : Dashboard
Addition: Inventory Relocation
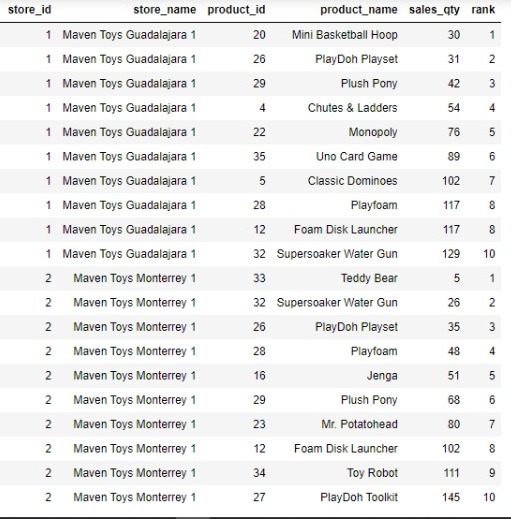
Every store has it’s own best and worst selling product. In order to optimize the sales, we will relocate one store’s lowest sales product to other store which record better sales for the product.
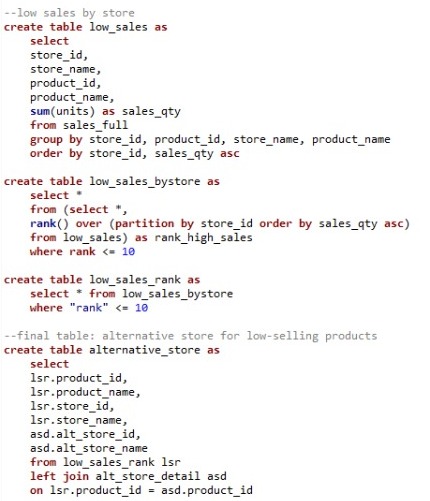
This is a list of 10 worse selling product from each store:
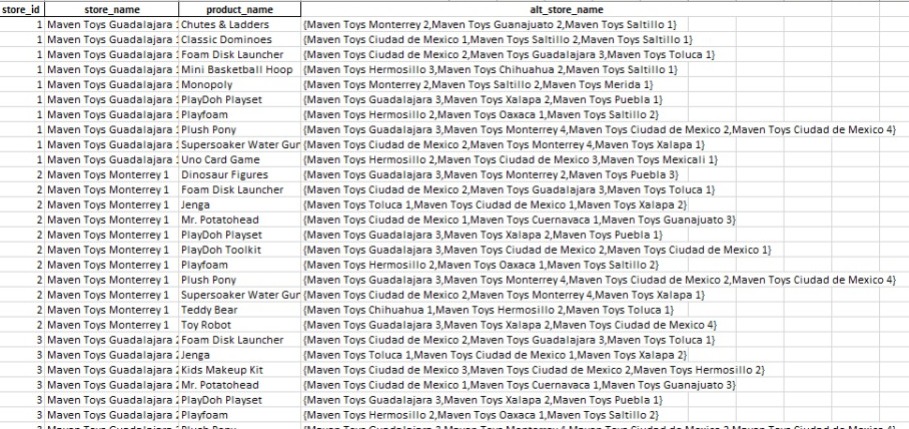
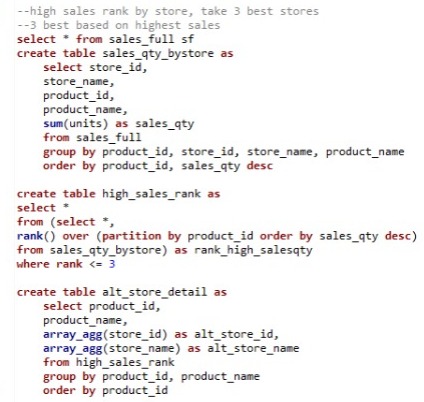
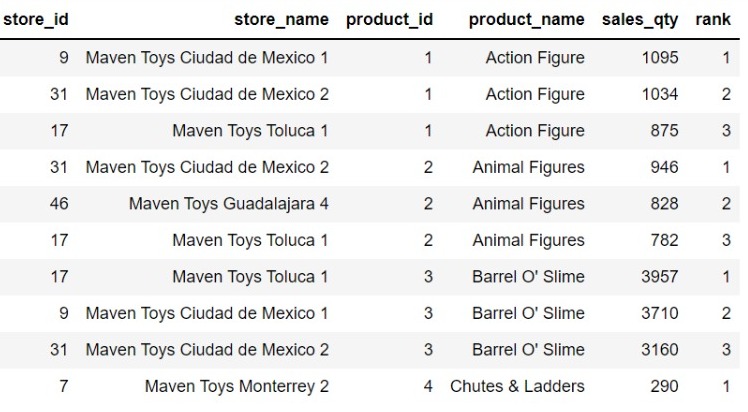
We will relocate to other store, the question is: to which one? Hence, we rank the 3 best selling stores for each product, to give option for the store to where it will relocate the bad selling product (logistic cost of relocation is not a consideration yet this time because we don’t have the data). This is a list of 3 best selling stores per product:
After that, we could know from which to which store the bad selling products must be relocated. The brief details could be seen below: (The full details could be seen on github, click the ‘See All Files’)
